A/B Test for an International Online Store
Detailed Project Link
How I Approached the Project
- Importation of the data and libraries
- Preprocessed the data and carried out exploratory data analysis
- Evaluated the A/B test results
- Selected the participants for the test
- Formulated and tested statistical hypotheses about the test results
- Conclusion and recommendations
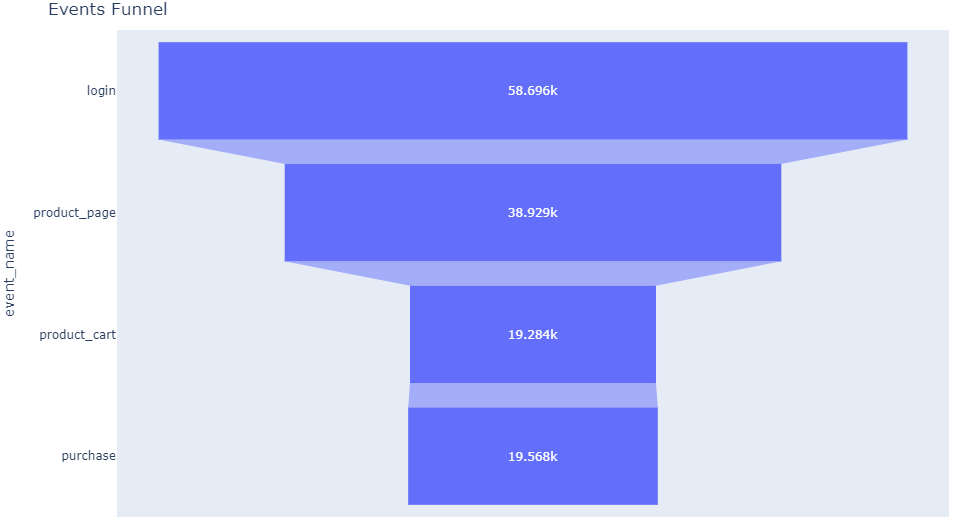
Customer Journey
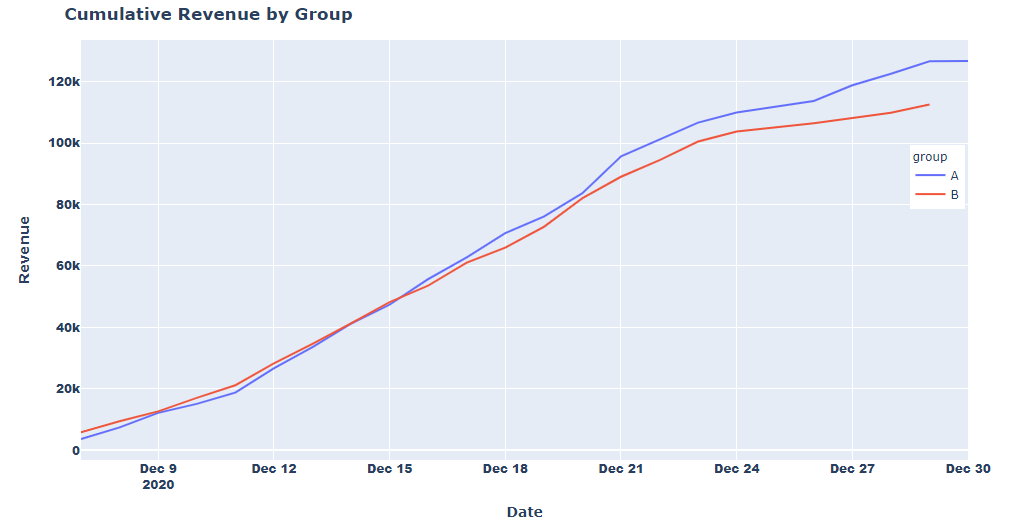
Revenue From Each Group
Cummulative revenue from group A exceeds group B
General Findings
- EU participants dominated all other regions in the sample.
- The maximum order total for purchase events is about $500.00, and the minimum is about $5.00, with a mean of about $23.88 and a standard deviation of about 72.22.
- About 66% of users proceed from login to the product page; about 50% of those at the product page proceed to purchase.
- About 15% of customers proceed to purchase without putting the product in the cart.
- About 33.33% of users convert.
- In the initial test by my predecessor, 441 users belonged in both groups, and 446 users participated in both test.
- The highest number of events occured on the 21st December, 2020 (14044 events).
- 8961 participants; representing about 23% of the new users on or before 21st December 2020, from the EU region were used for the test.
- There is statistically significant difference between groups A and B which implies the test was successful.
Recommendations
- Stop the test, there is significant difference between the groups. However, group A significantly exceeds group B in number of customers and revenue.
- Thus, there will be reduction in purchase with the introduction of the improved recommendation system; do not introduce the recommendation system.
Software and Tools